As at December 2020
Equity Market Returns
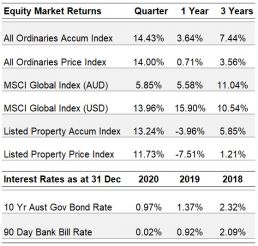
Source: IRESS
Overview
Equities and property markets rose sharply this quarter: the All Ordinaries rose 14.4%, the MSCI 14.0% (5.9% converted to A$), and the ASX Property Index rose 13.2%. Interest rates fell to zero and bond yields to below 1%.
The quarter has been eventful on a number of fronts; a sharp recovery in economic activity, chaotic US elections, a Brexit deal concluded, the perplexing conflict between Chinese Communist party and tech giant Alibaba and vaccine approvals (virus outbreaks).
Looking forward we expect that there will be higher dividends (or capital returns) paid by Australian and international companies. Portfolio companies have improved balance sheets and earnings, which will allow them to return to paying dividends more in line with pre-COVID-19 levels. Companies such as Rio Tinto and BHP have capacity to pay increased dividends as a result of increased commodity prices (the Economist Industrial Metals Index is up 52% over the last 12 months).
Despite the recurrent outbreaks of COVID-19 during the year, economies have recovered strongly, except obviously in industries such as travel, entertainment, overseas education and others directly affected by lockdowns.
When the virus appeared in the West at the end of February a far more prolonged and severe economic downturn was anticipated, with declines in asset prices and very large increases in employment.
Asset prices, however, have increased and unemployment has been dramatically below expectations.
Significantly, house prices have risen in most parts of the developed world and indeed the US has had a construction boom – the significance is that much of bank security (for portfolio banks) is underwritten by residential property. Additionally, sales of big-ticket consumer items such as cars and other consumer goods have grown strongly.
The December quarter was also notable for the recovery in many of the value stocks that the markets had shunned. In the financial sector, market attitudes improved to both banking and insurance stocks (IAG aside). Similarly manufacturing and construction stocks responded to growth in these sectors. Despite the very recent rises many stocks outside the tech sector remain attractively valued. We would like to re-iterate our view that the greatest risk in the equities market remains unsustainable valuation metrics.
Interest rates were lowered very dramatically this year as is indicated in the graphs shown later in this report. In developed countries cash rates are close to zero or below zero in Japan and Europe. Bond yields are also at historically low levels below 1% in the US, zero in Japan and negative in the Eurozone. It is the intention of central banks to keep interest rates at very low levels for the foreseeable future. Investment in this area is not expected to provide an acceptable return for the foreseeable future.
While it is too early to predict the course of CBD office property after the end of this pandemic and to what extent working from home is maintained, there seem to be some clear beneficiaries in the localisation of shopping and other daily needs. This sort of property investment has also been protected from the transition of retail to online delivery.
International Equities
The movement in global markets, as measured by the MSCI, were 14.0% for the three months to 30 September and 15.9% for the last twelve months.
As we have previously argued there is a wide and increasingly dangerous discrepancy between the valuation of technology stocks and that of other industries. The technology sector is becoming increasingly speculative, with the excesses moving on from large technology stocks such as Amazon, Facebook, Microsoft and Alphabet to more junior companies, such as Tesla and then to new listings. The rush of new listings has shown the extent of the speculation, which is appearing to resemble the very late stages of the 2000 technology bubble. In the September Quarterly report, we pointed to a number where the valuations were patently absurd. If anything, the new listings this quarter have become more so.
International Equities Performance
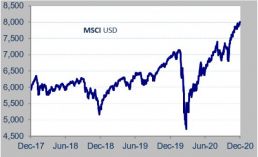
Source: MSCI
The portfolios have held Microsoft and Alphabet (aka Google) for many years, however these are now down to small exposures; the reduction is solely on valuation considerations. We continue to hold and acquire Cisco Systems, now a very mature company; the valuation is modest and business well positioned, as a result we think they will provide portfolios with an attractive utility like return.
There are a number of industry sectors which we believe are at attractive valuations, which we would like to discuss briefly.
We re-iterate our views of the financial sector. The economic recovery that has occurred over the last six months indicates that the market pessimism towards banks and insurance companies is misplaced. The sector, even after the recovery of the last two months, is valued at big discounts to traditional valuation metrics. Loan books have held their value with only modest provisions being required at the last reporting period. Security held against loans, largely residential housing in the banks held in the portfolios, has held its value or increased, improving the banks position. Unemployment, a major risk, has contracted and never reached the more pessimistic levels predicted. We expect that dividends (or capital returns) will return to pre-COVID-19 rates in the not too distant future. The modest recovery in share prices still leaves these companies substantially undervalued. Insurance stocks have recovered more strongly than banks to date but nevertheless remain in the firmly in undervalued territory. The recovery in economic activity is a positive development.
Among the consumer staples (Nestle and Kraft Heinz) improvements in operations are continuing at Nestle and signs are also appearing at Kraft Heinz. The latter was bought at such a deep discount we feel comfortable in being patient in the re-vitalisation of the well-known brands.
The pharmaceutical sector investments remain attractively priced particularly Merck & Co Inc and Bristol-Myers Squibb, which have large and growing oncology franchises. Similarly, in diabetes medicines produced by Eli Lilly and Novo Nordisk have dominant shares of a growing market. The latter has had an unexpectedly good year, despite COVID-19 headwinds. Stryker Corporation, a robotic surgery and implant company, has had a substantially better year than might have been expected given the drop in procedures and we are expecting the low level of procedures to be a temporary phenomenon.
While Tesla might have stolen the limelight and now represents nearly 40% of the market capitalisation of the automotive industry, they only produce approximately 0.5% of global car production. With the reduction of battery costs, the trend in legislation favouring electric cars and the commitment of some of the major brands there seems to be the basis of a significant restructuring of the industry. We believe there will be beneficiaries of this and VW, the largest producer is well placed. In contrast to Tesla’s incomprehensible valuation, VW’s is extremely attractively priced.
As argued in the September Report the Tech Sector and the value portion of the market need not go in the same direction and when the 2000 Tech bubble burst there was a huge divergence; technology stocks going down 60% and the types of stocks held in our portfolios going up 10%. This we think will be how the current situation will go. The major issue is technology stock valuation, not economic growth or corporate financial distress – the “old economy” is not overvalued.
Australian Equities
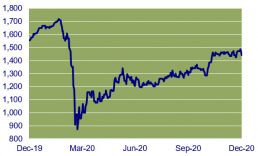
Australian Equities Performance
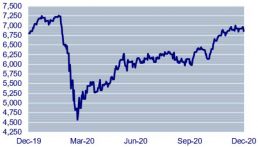
Source: IRESS
Australian equities staged a strong rebound in 4th quarter 2020 as investors gained confidence over COVID-19 containment policies as well as over further government measures announced in the budget to support and provide stimulus to the economy.
Government spending initiatives will deliver a budget deficit in the order of 11% of GDP, a post WWII high. The spending is contained within major business and employment support measures, which will see debt levels expand over the forward estimates period to around 44% of GDP. Given the challenges to the economy, this level of spending was taken by the markets to be appropriate. Australia is also in the fortunate position of having relatively strong fiscal settings, allowing it to accelerate spending aggressively while maintaining confidence of the markets.
Although measures of confidence in the economy can be fickle, given the nature to the pandemic induced crisis, they are probably unusually useful in gauging the response to the fiscal support measures. From this perspective the indicators are very positive, with both consumers and businesses showing sharp recoveries in confidence from earlier plunges.
Australian Business, Consumer Confidence
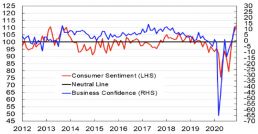
Source: Citi Research
This positive backdrop played particularly well for the long-shunned value end of the market. This included the banking sector which started to show evidence of a recovery in share price after a long period of relative and absolute decline in the market.
Performance of the 3 major banks which reported earnings during the quarter provides valuable insights into this crisis and requires us to first go back to the early stages of the crisis where the banks were assessing their loan books and making provisions against expected losses. In each case, the banks used very conservative assumptions and erred on the side of the downturn being steep and relatively long in duration.
In the case of Westpac, as an example, the level of provisioning was centred around a base case forecast of GDP declining 5% over 2020, unemployment reaching 6.8% and residential property prices plunging 15%. For GDP and property, the forecasts look exceedingly conservative and are the kinds of numbers you would expect in a very severe recession. Each of the banks used similar methodology.
We suspect that this level of provisioning could provide a useful tailwind to earnings for the banks in the periods ahead, specifically if they find themselves with excess provisions resulting in a write back to earnings. At the same time and against a benign credit environment, we have seen a step-up in capital levels across the 4 majors. A CET1 ratio above 11% places each of the banks in the unquestionably strong category which the RBA has been guiding them towards over several years.
CET 1 ratios step up
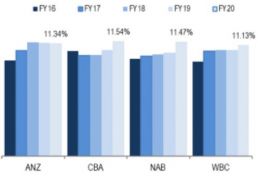
Source: Citi Research, Company Data
In terms of capital strength and what appears to be a very cautious approach to building buffers against bad loans, the banks are undoubtedly well positioned.
A factor which is not so obviously in the banks’ favour is the subdued level of loan growth. Despite this, we are of the view that given the banks’ return on equity against valuation levels – in line with book value (WBC) or slightly ahead of book value (ANZ, NAB), the loan book does not need to grow significantly for them to produce attractive returns, particularly for zero tax paying entities.
The resource sector, ex energy, has delivered very strong returns over the last 12 months. PPM’s main exposure comes through the diversified miners BHP and Rio, to which we have now added specialist gold miner, Newcrest.
For both BHP and Rio, the main commodity of interest is iron ore, which because of strong demand from China, in addition to supply constraints on the part of Australian and Brazilian producers, has resulted in a near record high price for the commodity in Australian dollar terms.
Iron Ore Price
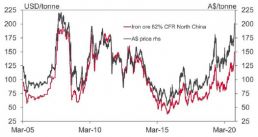
Source: Bloomberg, Westpac Strategy Group
With a cost of production less than $15 per ton, both companies are delivering very attractive returns. However, we would make the further observation that outside the current period and the preceding mining boom period (2009 – 2014), such a price level is very unusual and is best considered unsustainably high. Eventually this price boom will correct but for now, given supply demand conditions, we are comfortable with our exposure.
Finally, a note on market valuation. A strong recovery in the share market back to pre-COVID-19 highs, along with near term downgrades to corporate earnings, has left market valuations in an extended position. While historically low interest rates provide clear support, we will need to see a significant recovery in market earnings to justify current pricing.
ASX 200 – Latest 19.5x
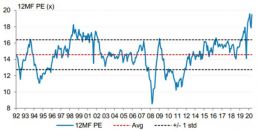
Source: RIMES, IBES, MS Research
Interest Rates
90 Day Bank Bill (%) vs 10 Year Bond (%) Performance
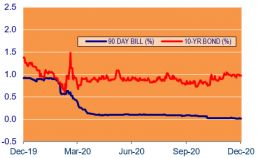
Source: IRESS
The Reserve Bank of Australia (RBA) cash rate was 0.75% at the opening of 2020, an historically low rate for Australia. However, since then, we have seen three more rate cuts and the cash rate is now 0.10%. In addition, the RBA has a target of around 0.10% for the yield on the 3-year Australian Government Bond.
More importantly, the bank “remains committed to not increasing the cash rate until actual inflation is sustainably within the 2 to 3 per cent target range. For this to occur, wages growth would have to be materially higher than recent levels. This would require significant gains in employment and a return to a tight labour market. Given the outlook the Board does not expect to increase the cash rate for at least 3 years. It remains appropriate to remove the yield target before the cash rate itself is increased.”
Central banks have made similar statements and until COVID-19 case numbers begin to decrease we expect interest rates to remain effectively at zero and accommodative monetary policy to continue through 2021.
At its last meeting for 2020, the US Federal Reserve stated that it is committed to using its full range of tools to support the US economy in this challenging time, thereby promoting its maximum employment and price stability goals.
Property (REITS)
ASX Property Graph
Source: IRESS
Calendar year 2020 has been a very extraordinary year, and the property sector was not immune to market volatility. The headline A-REIT accumulation index ended the year down 4%, rebounding strongly after the sharp decline in the first quarter. However, share price recovery for the listed property players has been uneven.
The market continues to favour select names that are either exposed to a structural tailwind like Goodman Group (online retail) or offer better earnings feasibility like Charter Hall Group. Certain segments of retail exposed property stocks have also fared better, typically ones that have minimal discretionary exposure. BWP Trust, which predominantly houses Bunnings as its anchor tenant, was up ~8% for the year. Shopping Centres Australasia (SCP) and Home Consortium (HMC) also performed relatively better as their supermarket tenants have been resilient during the pandemic.
On the other side of the spectrum, Scentre Group (SCG), Vicinity (VCX) and other larger format shopping centre owners with high exposure to discretionary retail continued to underperform, as the pandemic has exacerbated the already challenging backdrop for these retailers. The office sector has also been hit hard by the pandemic, as more people are working from home.
Spread of REITS Dividend Yield vs 10 Year Government Bond Yield
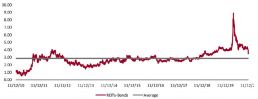
Source: FactSet
Aside from a select few who have had a good run, valuation is not excessive with some listed property players trading at below book value. In the current low interest rate environment, the REITs sector may offer an alternative for income seeking investors.
PPM is continuously looking for ways to improve the service we provide to you and your feedback is important to us. We hope are staying safe and healthy. Please contact Jill May, Senior Client Relationship Manager with any questions, comments or suggested improvements at jm@ppmfunds.com or on (02) 8256 3712.
Private Portfolio Managers Pty Limited ACN 069 865 827, AFSL 241058 (PPM). The information provided in this document is intended for general use only and is taken from sources which are believed to be accurate. PPM accepts no liability of any kind to any person who relies on the information contained in this document. The information presented, and products and services described in this document do not take into account any individuals objectives, financial situation or needs. The information provided does not constitute investment advice. You should assess whether the information is appropriate for you and consider talking to a financial adviser before making any investment decision. Past performance is not necessarily indicative of future returns. © Copyright 2021 Private Portfolio Managers Pty Limited ABN 50 069 865 827, AFS Licence No. 241058.
Your Investment Management Team

Hugh MacNally
Portfolio Manager,
Executive Chairman

Peter Reed
Portfolio Manager,
Director

Ian Hardy
Portfolio Manager,
Director

Franklin Djohan
Portfolio Manager

Max Herron-Vellacot
Analyst

Neil Sahai
Dealer / Analyst