
Market Volatility is Common: However, Long-Term, The Important Thing is Earnings
Howard Marks, the highly respected investor and observer, commented that while markets can swing from “flawless” to “hopeless,” real economies tend to move from “not too good” to “not too bad.” As we argue below the important thing is to focus on the real as the emotional (flawless/hopeless) will be consigned to history. The long-term returns from investment portfolios are determined by the returns that companies generate.
The emotional is driven by all sorts of things: this can be interest movements, wars (distressingly frequent, but not a good investment tool!), etc. Let’s focus on interest rate movements, as the biggest current concern.
The chart overleaf is the US short-term interest rate over the last 25 years. During the period post the GFC and Covid the rate was close to zero and earnings growth was high as you can see from Chart 2, but earnings growth was also high last year when interest rates were high and rising. There doesn’t seem to be much correlation.
You might argue that the rise in interest rates haven’t taken effect yet and the decline in earnings will come later, and that may be true. But downturns tend to be short and new highs in earning over the last 25 years have been made shortly after the previous peak.
This brings us to Chart 3. It shows the annual returns from the S&P500 (a broad index of US stocks). Talk about fluctuations, Howard wasn’t wrong!
You get exhausted just looking at it. The point being that the prospect of picking so many changes in direction is very low indeed, and the margin for error is tiny. Most people are better at picking one change of direction, either downturns or upturns, but hardly ever both; the result is not going to be good.
Perhaps a better strategy is to remain invested and forget the predictions that swing people’s emotions from one extreme to another. Over the last 25 years the market has produced a return of approximately 10.0% p.a., which is remarkably close to the average annual growth in Earnings Per Share of approximately 11.4% p.a. over the period.
Unless you genuinely enjoy playing roulette, and enjoy the thrill of wins and losses, the long-term approach seems a much better way to go.
Be aware though, it is not easy to maintain discipline, one’s emotions are difficult to control, particularly in collective situations. (If you are playing golf, play golf, don’t talk stocks! It’ll help both your score and your portfolio).

The Chart shows the US Federal Funds Rate – a short-term interest rate set by the Federal Reserve (the US central bank).
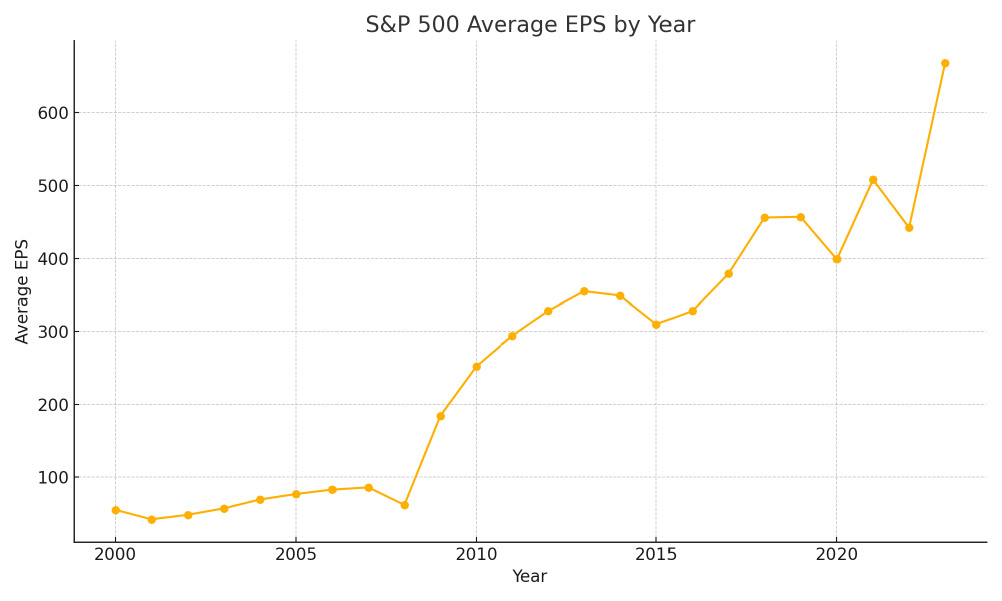
Chart 2 shows the collective earnings per share of the stocks that make up the S&P500 Index. Effectively it is as if all these companies were a giant conglomerate; usually shown as cents per share.
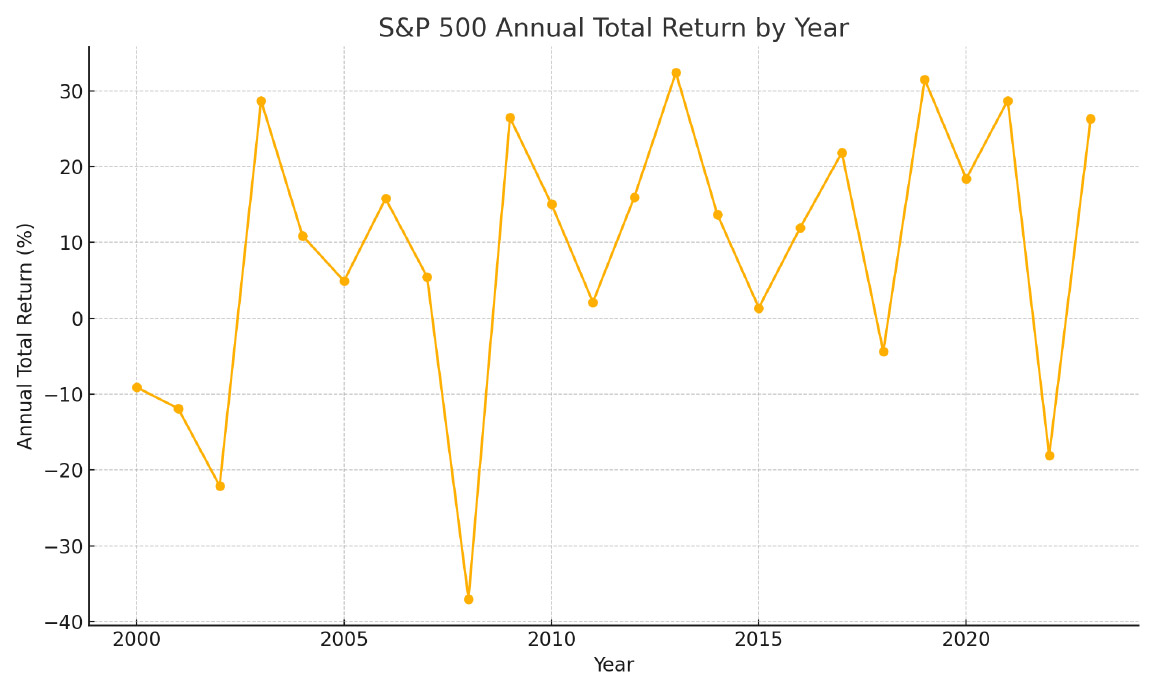
Chart 3 shows the change in total return, dividends and capital gains, from one year to the next. As can be seen the returns fluctuate from over 30% to declines of over 30%. Perhaps, the “Flawless/Hopeless Indicator”?
For further information on Private Portfolio Managers Pty Limited (PPM) and our service offering please contact Jill May, Head of Client Relationships or your Portfolio Manager on (02) 8256 3777 or jm@ppmfunds.com